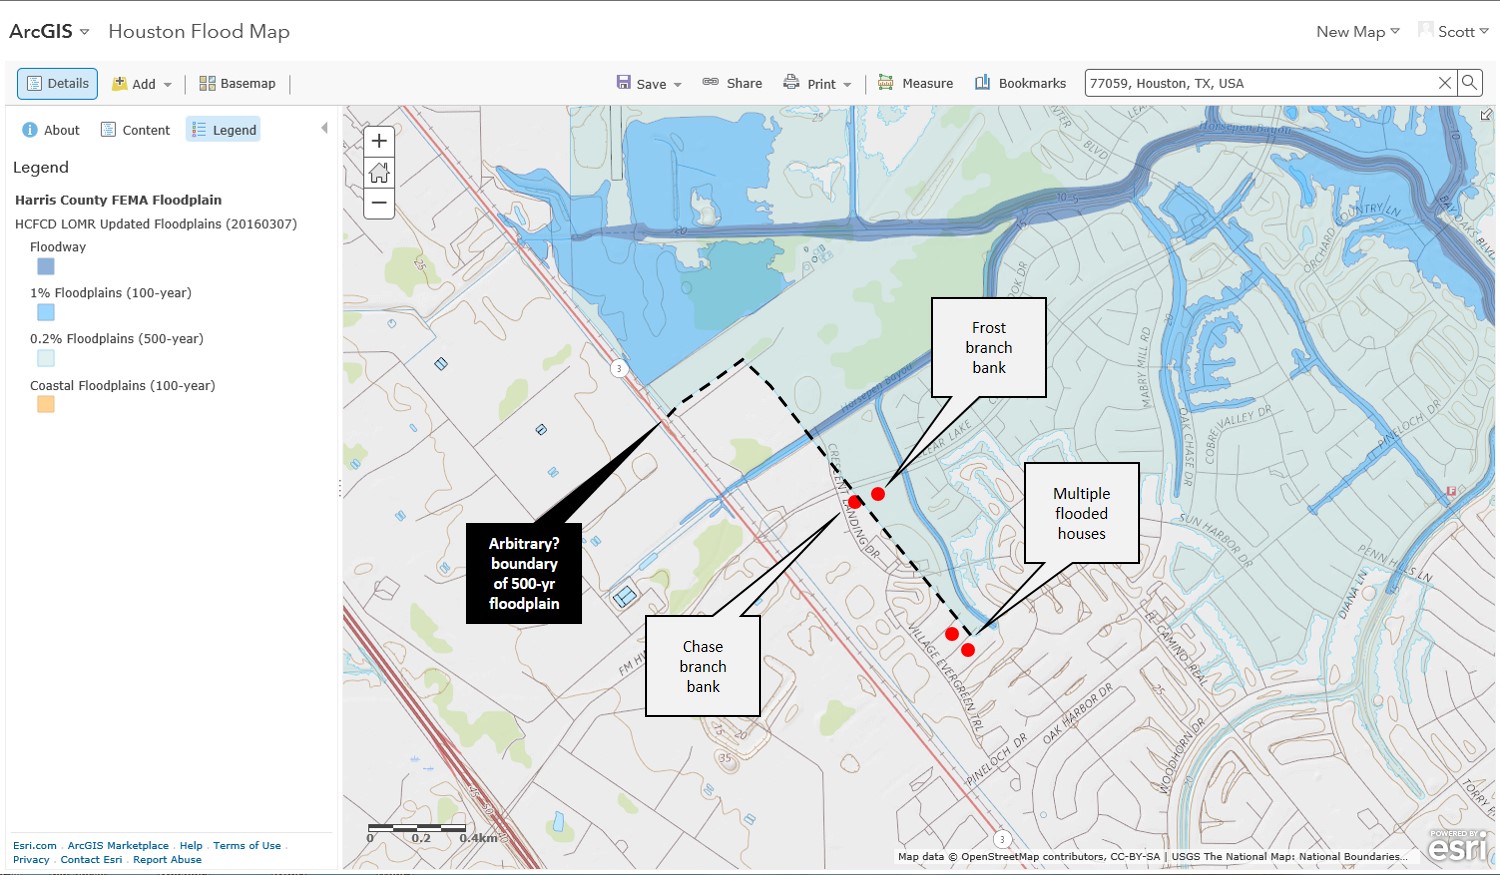
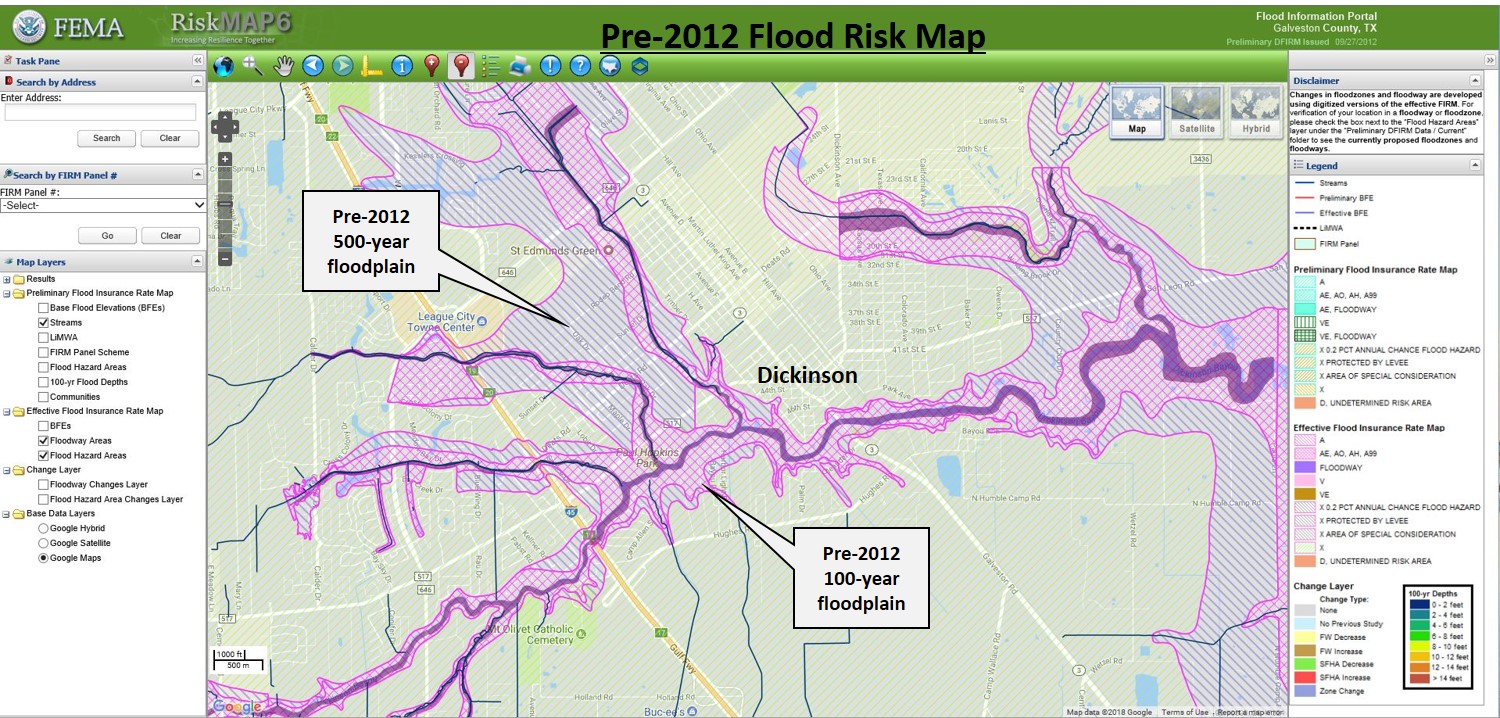
Arbitrary floodplain boundary example
While researching actual damage to businesses during Hurricane Harvey in my local area of Harris County, I found a Houston Chronicle article entitled "Harvey floods damaged 100s of safe-deposit boxes". The article was written by Paul Takahashi and is dated October 2, 2017.
Mentioned in the article is that the Clear Lake City Boulevard branch of Chase Bank was one of nine branches that were flooded during Harvey. Driving by that area in the aftermath of Harvey I had noticed that the building was closed for repairs. The nearby Frost Bank branch was also closed. It is likely that if these two buildings were flooded then a number of other nearby structures in the area were also flooded. I was able to identify an area of flooded homes south of the Chase branch bank building in the Bay Knoll subdivision.
One of the themes of this blog is comparison of actual damage from Harvey to predictions of flooding risk from flood hazard maps. The FEMA National Flood Hazard Layer map (NFHL) shows the Frost Bank building in the 500-year floodplain however the Chase building and the Bay Knoll flooded homes are in Zone X - Minimal Flood Risk (see Map #1).
Particularly notable is that the edge of the 500-year floodplain in this area is defined by straight lines suggesting some non-natural factors have been used to draw the boundary. Normally the floodplains generally mimic the topography and are shaped beyond that by modeling of runoff rates and drainage capacity. These parameters are not likely to generate straight line boundaries.
Map #2 is the detailed topography in the area from Digital Elevation Models (DEM) maintained by the US Geological Survey (USGS). The topography of this portion of Clear Lake City slopes from southwest to northeast interrupted by a low area associated with the Horsepen Bayou. This model has enough detail to define very small elevation differences such as those between home lots and streets. Although subtle these features can be critical in determining whether or not flooding will occur in one area versus another.
In the vicinity of the damaged Chase Bank building and the flooded Bay Knoll houses there are low areas that could be considered extensions of the 500-year floodplain. If the floodplain map included these areas instead of having the arbitrary-looking straight edge boundary it could have provided a more realistic representation of the true flooding risk.
Readers - are you aware of the details of the floodplain map for your area, especially if your house is close to a boundary or has been flooded even though it is in Zone X? The statement is often made that "the floodplain maps are wrong", but if so what are the reasons?


Comments
Post a Comment