Insights from detailed topographic map
The United States Geological Survey (USGS) assembles and maintains the National Elevation Dataset (NED). NED is designed to provide national elevation data in a seamless format with consistent datum, elevation unit, and coordinate reference system.
These map products are available at the following resolutions: one third arc-second (approximately 10 meters) for the conterminous United States and portions of Alaska, one arc-second (approximately 30 meters) for the conterminous United States, Hawaii, Puerto Rico, U.S. territorial islands, Mexico, and Canada. A resolution of two arc-second (approximately 60 meters) is available for all of Alaska.
Refer to the link below to view the maps and for additional information.
The highest resolution products however are not seamless but are available for large portions of the United States. These NED are available at one ninth arc-second (approximately 3 meters) resolution. Each pixel on the map image represents an area on the ground of approximately 84 square ft. This level of detail is very good for illuminating local topography in detail as can be seen in the maps presented later in this post.
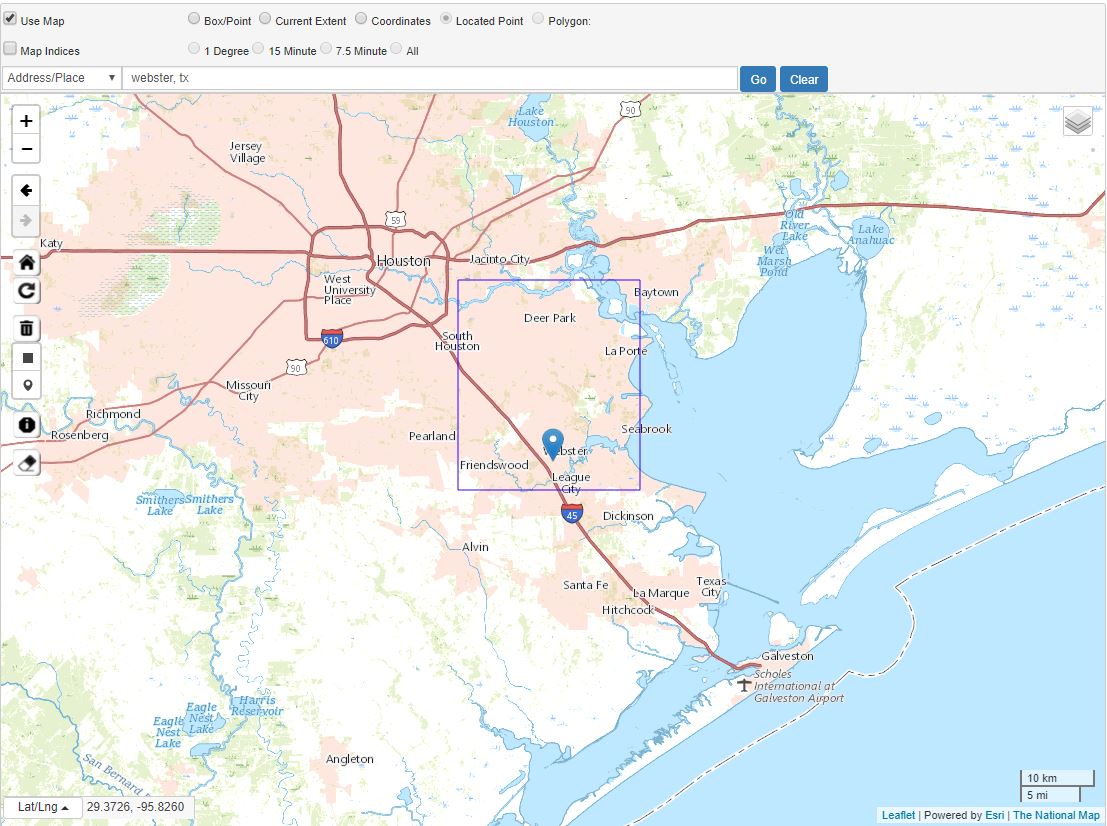
For the Clear Lake City (CLC) area the downloadable NED one ninth arc-second product covers a 15 minute by 15 minute quadrangle that stretches from Deer Park to League City in the north-south direction and from Pearland to Seabrook in the west-east direction (see Map #1 below). The Clear Lake City area is located in the central southern portion of the quadrangle.
Map #2 below shows the Clear Lake City area with Floodways highlighted for reference.
Floodways in Clear Lake City are formed both by natural waterways such as Horsepen and Armand Bayous as well as by man-made features such as the detention pond in the central portion of Northfork. These are the areas at highest risk for flooding damage, are the areas of lowest topographic relief, and they contain water intermittently to continuously.
Map #3 shows the detailed NED topography as a raster image with the Floodways superimposed. The light gray, lime green, and yellow colors show the highest elevation areas. The blue, green, and dark gray colors indicate the lowest elevation areas. The general topography of Clear Lake City deepens from west to east towards Armand Bayou. There is a significant central low area associated with Horsepen Bayou that spreads out to cover most of the Bay Glen and Bay Oaks neighborhoods.
One prominent high area is a ridge-like feature running north to south through Pinebrook and Middlebrook into eastern Bay Oaks and western Brookforest. Another topographic high extends from Sterling Knoll and Pipers Meadow through Meadowgreen into Oakbrook and Oakbrook West.
Particularly notable from the detailed topography are areas where home lots are elevated significantly above street level such as in Pinebrook and eastern Bay Oaks. In contrast the Sterling Knoll and Meadowgreen neighborhoods have very little difference in elevations between home lots and the streets. Elevation of the home lots above the streets and storm drains is an important factor that mitigates flooding damage in CLC.
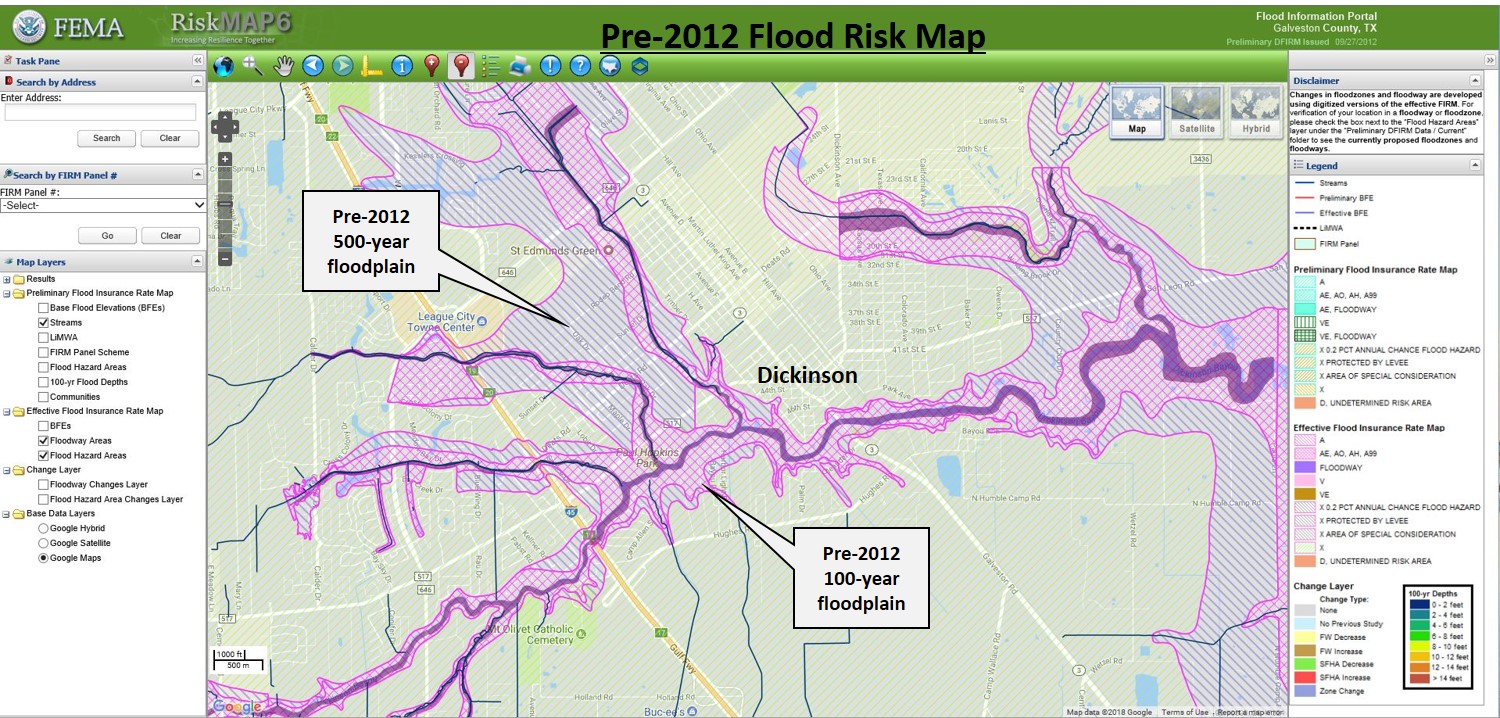
Map #4 shows the detailed NED topography and Floodways again with the 100-year and 500-year flood plains superimposed in purple.
This display provides valuable insight regarding flooding risk and historical flooding in Clear Lake City. Flooding damage has in fact often occurred in the flood plains and next to Floodways as would be expected, but has also occurred away from flood plains where home lots are not significantly elevated.
Many other factors not evident from the topography and flood zone mapping have also caused flooding damage. Investigation of those factors would be of interest to residents or prospective homebuyers, however relevant information is difficult to obtain. The detailed topography as presented here provides a starting point for improved understanding of flooding risk in one area versus another, and in some cases an explanation of the reasons for previous damage.
If you are familiar with the study area does this presentation help you to understand flooding-related issues? Are there areas of chronic flooding that cannot be explained by the topography and flood risk maps?


Comments
Post a Comment